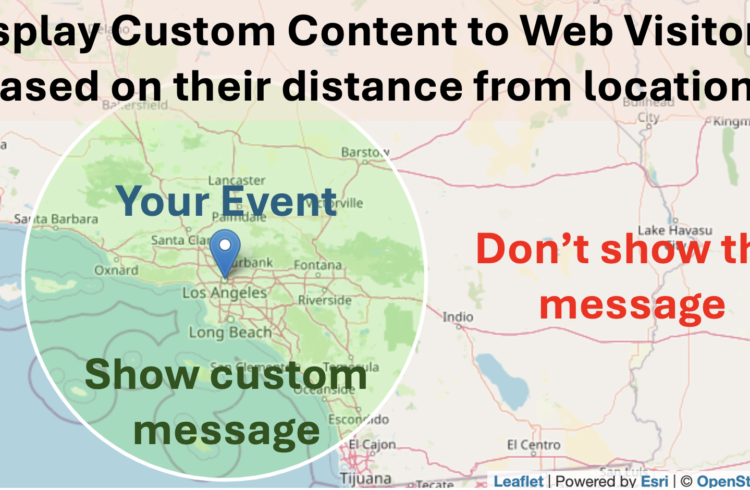
Have you ever wanted to show an advertisement or promotional content to users on your website if they are within 100 miles of a particular location? You may want to do this if you are speaking at an event in San Francisco, CA and want to show any users that are within 100 miles of […]
Author: Ryan S
Do you remember what your router’s IP address is? Just use this web-based tool to quickly determine what your IP address is. Simply click on the link and it will take you directly to your router. This tool is a snippet of what’s available. Click here to see more info on you Find my router […]
Have you ever wondered what type of information that websites and apps can collect about you? There are various techniques that they can use to track you and tell who you are, even if you are behind a VPN. Please take a look at what information I have gathered about you. Please also try hiding […]
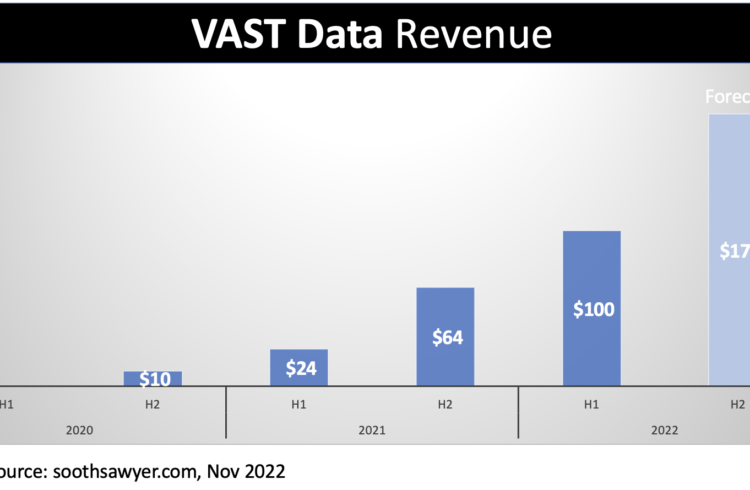
I came across enough hints from VAST Data thru their momentum posts, that I was able to determine their actual revenue to date along with an estimated NAND Flash TAM. In addition, using LinkedIn, I was able to breakdown their sales force to see what the team looks like. Why did I do this? I […]
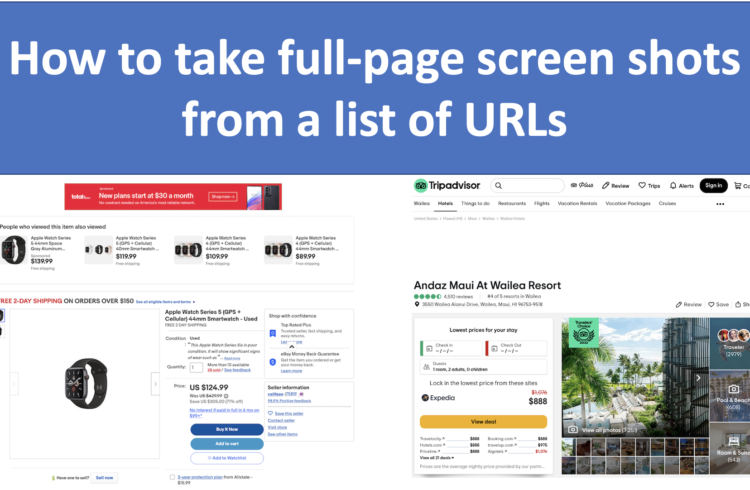
Do you have the need to take full-page screenshots from a ton of URL’s? Well you are in luck. I have tried many methods to get the best outcome that correctly captures web pages (including javascript-based pages that cause problems for many automated capturing methods). I also take care of ‘lazy loading’ web pages that […]
For vacations, Roku is a great device giving you access to all your streaming content from HBO, Netflix, Hulu, Disney+, YouTube, and more. But what happens when you forgot to bring your Roku remote? You can’t connect it to the new WiFi network and you can’t control it using your Roku app. Well, I have […]
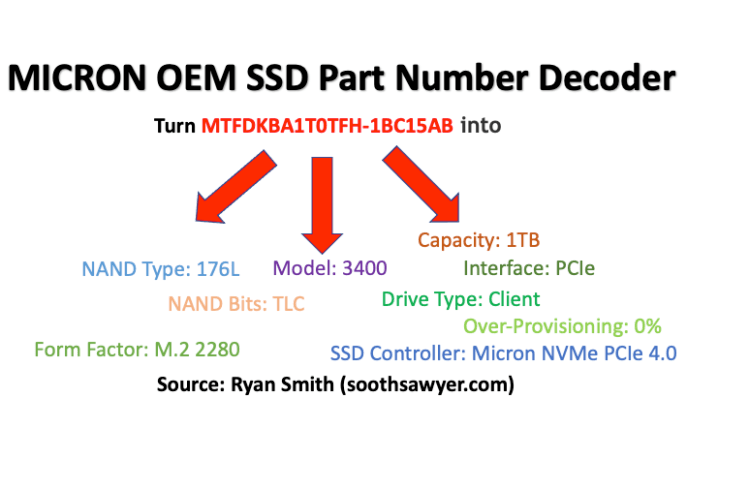
I created a Micron OEM SSD part number decoder that will take any Micron SSD Part Number and decode it and tell you the model name, what type of NAND Flash is used, estimated manufacturer cost, and more. Note: this decoder is not endorsed or supported by Micron; this is an unofficial decoder developed by […]
Here is a short clip I created that loops to allow for a fun Zoom virtual background that looks like you are working on the 6th floor balcony of the Honua Kai in Kaanapali, Maui, Hawaii. There are two versions of this Zoom Background you can download: And don’t forget to throw on the requisite […]
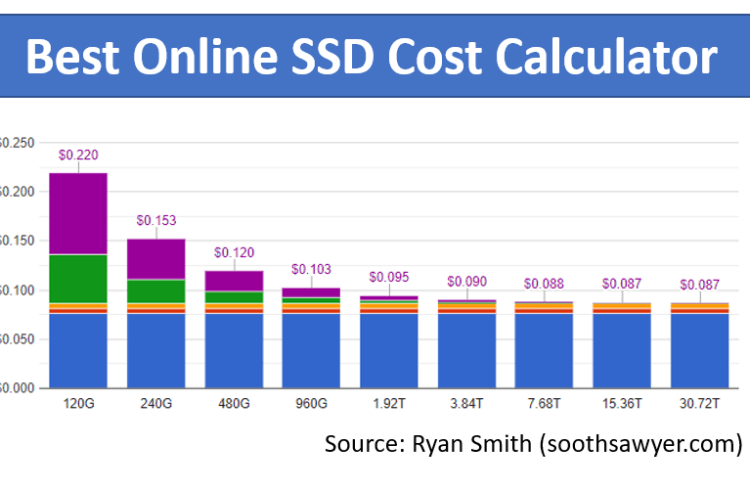
This is an online SSD Cost calculator that calculates the detailed costs of an SSD (NAND, DRAM, Controller, Other) at various capacity points. You can view the graph/table by $/GB, Unit Costs, or % of Total. Please give it a try. (Bonus: It is mobile and printer friendly) Tip #1: You can scroll down to […]
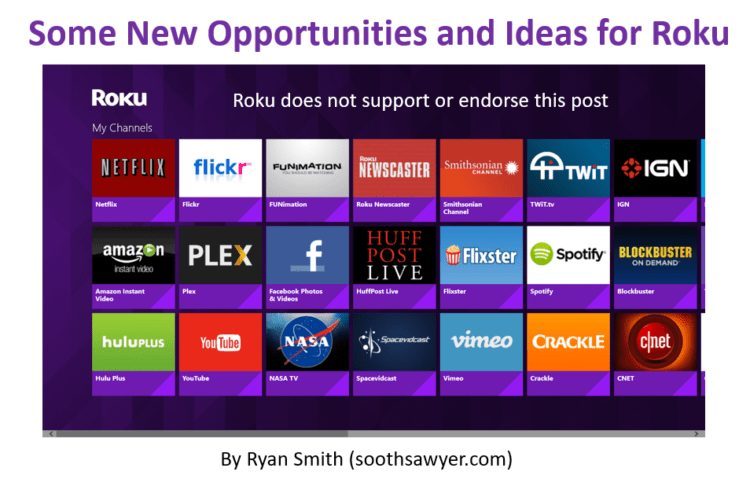
This is a one-hour brainstorming (more like a brain dump) session I had on areas that Roku can improve it’s offering and/or user experience, as well as cover some areas of opportunity. I think Roku has one of the best OTT offerings out there and I have them on all my TVs but there is […]
Flash and DRAM demand has apparently been weak. This is a great opportunity for you to negotiate lower prices with your favorite #semiconductor company. Give your local sales person a call and ask for a revised quote. From what I can tell, weakness was led by the following players: The largest NAND Supplier in June (more in […]
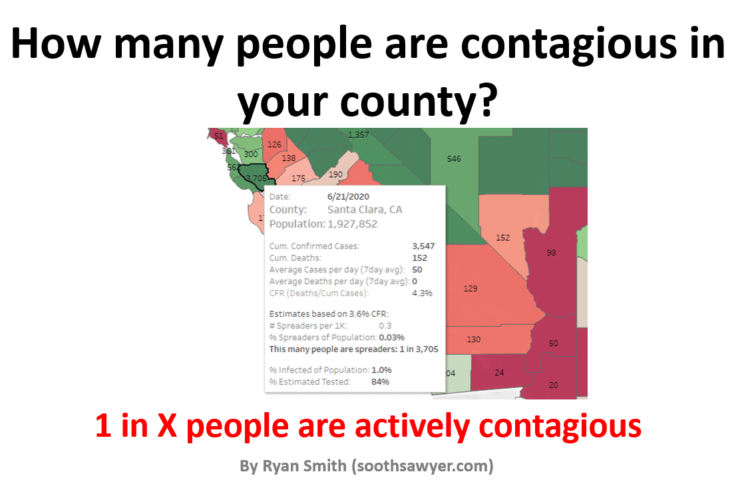
Have you wondered how to translate COVID-19 cases and stats into meaningful information like how many people around you are *actually* contagious? If so, you found the right place because this interactive map of the U.S. will show you how many people you have to be around to statistically bump into 1 person that is […]
Do you pay for internet speeds >50Mbps? >100Mbps? You could be saving over $50/month just by reading this post. Save your money, you don’t need an internet plan higher than 50Mbps. Chances are, you just need to get a better Wireless Router or if you are lucky, you may just need to better locate your […]
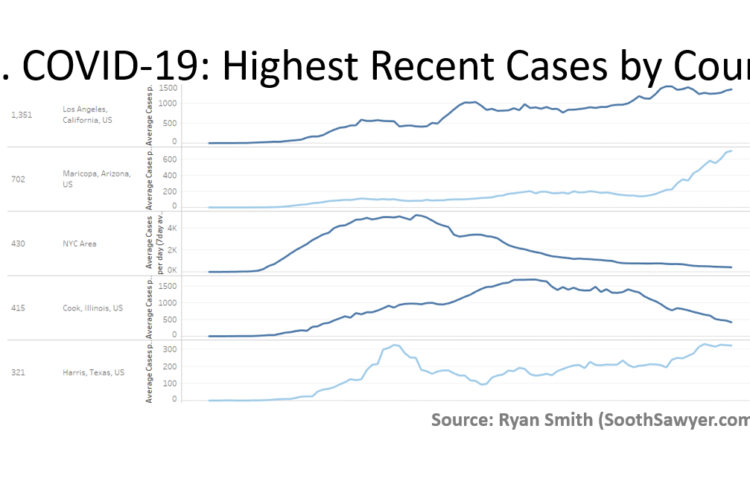
My Tableau visualization will allow you see the current hot spots (sorted by highest [7-day] average number of new cases in the last 15 days) in the United States. This has all 3,000+ U.S. counties and shows you the average daily new confirmed cases (moving 7 day average). Additionally, the color of the graph indicates […]
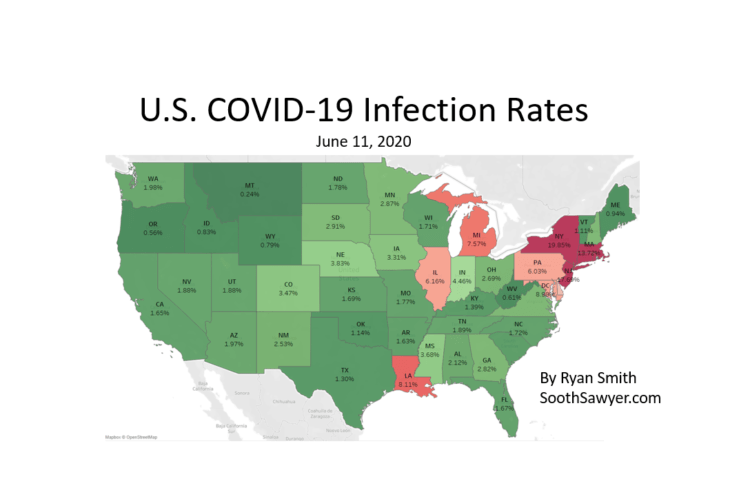
If you have been wondering what the infection rates for COVID-19 are in your state or county is, you found the one place on the internet that will cover just that. After analyzing numerous antibody studies, filtering out the non-scientifically approached ones, and correlating that with (1) other studies that looked at asymptomatic infections and […]
How do you actually use the data out there to determine your chances out there? I see the news cover confirmed cases and deaths but how does this actually translate into understanding what are your chances of bumping into someone with this invisible virus when you go grocery shopping? In order to help solve this […]
This post contains links to the Keystroke and Mouse Recorder demo that I created using PHP, Javascript, JSON, AJAX to show how easy it is to “screen record” your mouse movements and keyboard strokes (including password and credit card info) on the web. The Web Page Keystroke and Mouse Recording Demo I think it’s best […]
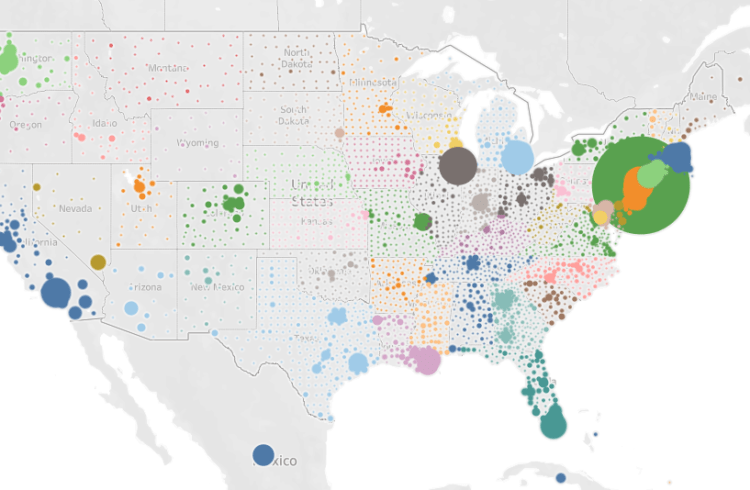
Click here to enlarge the picture Sometimes when you are playing with visualizations you run across something that captures your attention. This happened when I was looking at the over 3,000 counties in the United States, using population density. In effect, the image you are looking at above is the United States. I normally don’t […]
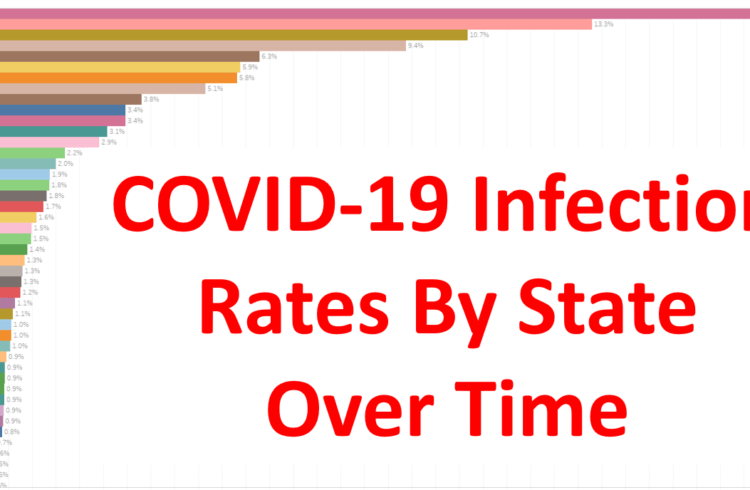
Hit play to see my estimate of infection rates over time for COVID-19 in the US: This is a race chart I put together using Tableau that illustrates my estimations on what each US State’s COVID-19 infection rate is on a given date. The estimation is based off of comparing many antibody tests versus actual […]
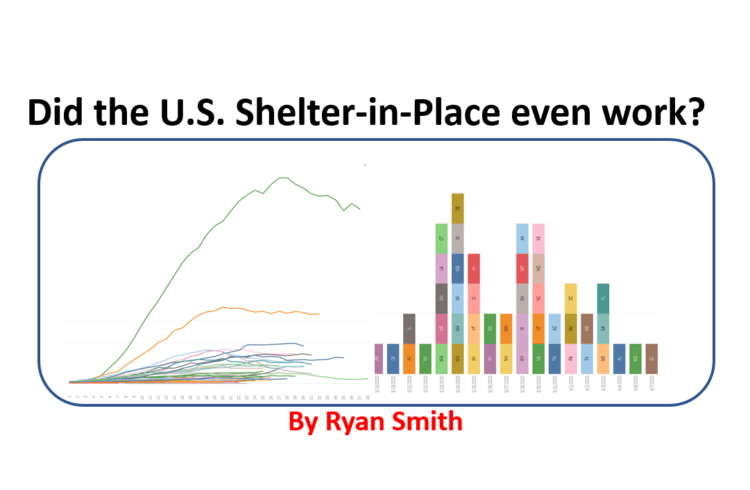
In this post, I look at all states in the U.S. by date, days since each state hit 500 cases, and days since each state’s respective shelter-in-place order. Each of these comparisons provide a unique way to accurately look for correlations. I then identify where each state’s peak is, and then compare how the U.S. […]
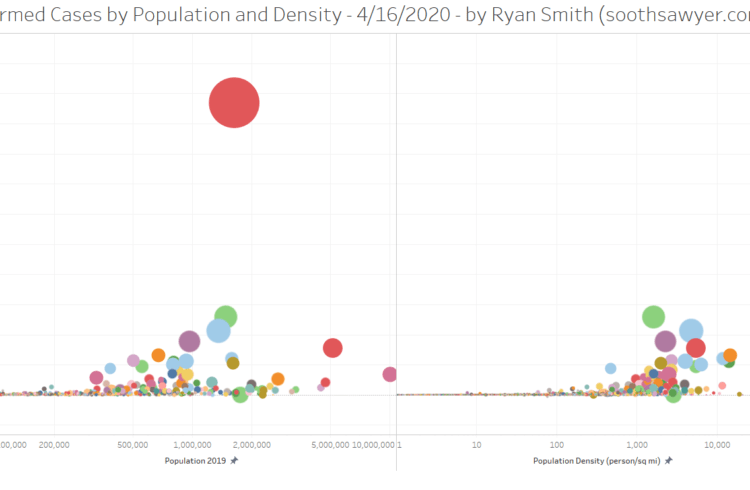
This visualization shows the growth in COVID-19 cases compared to population (4/16/2020, R=0.33) and population density (4/16/2020, R=0.75; if you look at this by Days Since instead of date, R>0.80) in the US (and the rest of North America), at the county level, from March 15th – April 16th. If you hold your mouse over […]
This visualization shows the growth in COVID-19 cases in the US (and the rest of North America), at the county level, from March 15th – April 15th. If you hold your mouse over a given county it will show you the cumulative cases/deaths, new cases/deaths, and ICU beds, in each county. You too can create […]
This is the ultimate GLOBAL data set for COVID-19. It provides population, deaths, land area, ISO codes, confirmed cases, deaths, ICU beds, workers, workers that take public transit, new and cumulative cases/deaths/recovered, day numbers (to compare on set of outbreak or quarantine dates), and more ..at the county level! Go to the bottom of the […]
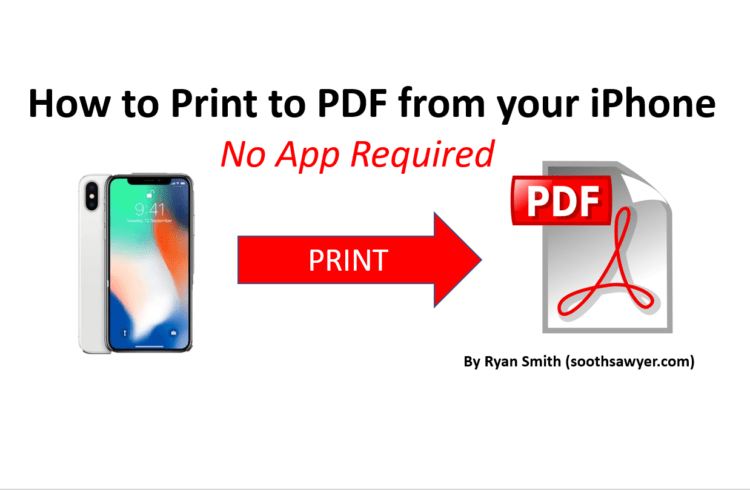
I just learned how to do this and couldn’t believe this was built into the iPhone this whole time. I love to be able to capture emails and/or web pages to PDF so that I can share them easily or save them for future reference. I always thought an app was required to have this […]
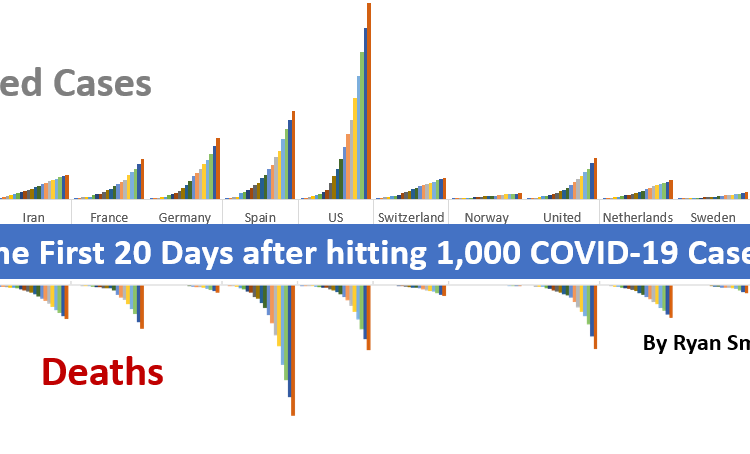
In this post, I thought I’d share with you a quick glance of what it looks like for every country that has had at least 20 days since hitting 1,000 cases, as of April 7, 2020. Let’s get started. First we will look at total confirmed cases. To orient yourself with my chart, the date […]
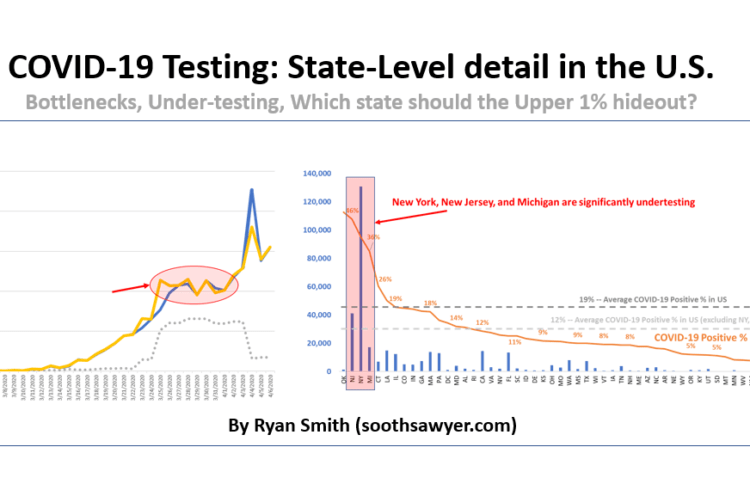
In this post, I will take a quick look at how testing is going in the United States by looking at how our testing has ramped, bottlenecked, where most of the test kits are going, where likely under-testing is happening, what the likelihood of testing positive is, and which state the upper 1% should hunker […]
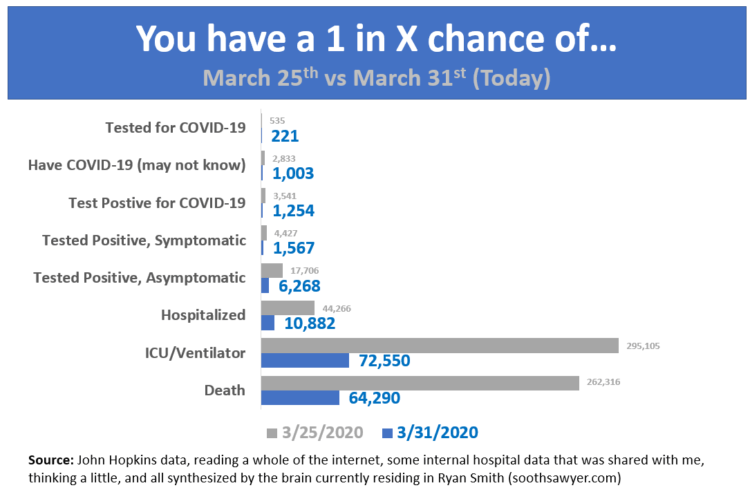
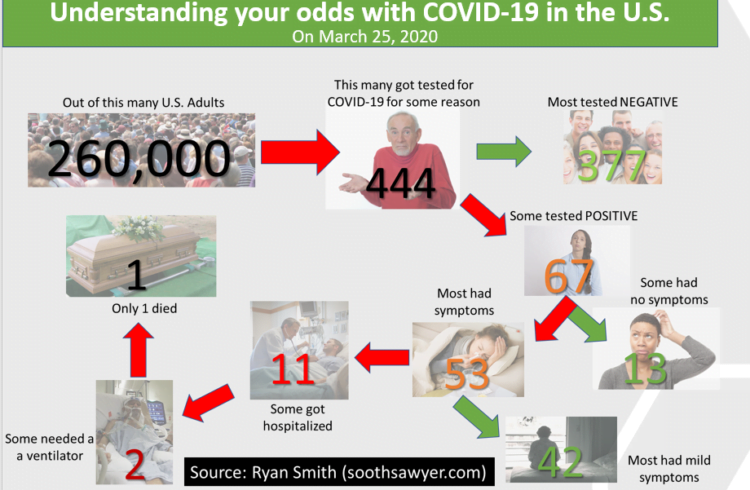
A quick graphic I put together to easily understand all the stats and what it means to you.. The data in this chart is all calculated based off of adults in the U.S. (257 million adults). -Ryan Ryan SI have been around IT since I was in high school (running a customized BBS, and hacking) […]
When it comes to COVID-19, it can be hard to understand how all these percentages and statistics you hear on the news are relevant to you. For this reason, I thought I’d create a simple illustration based on where things are at in the U.S. (based on my understanding of today’s figures, as outlined in […]
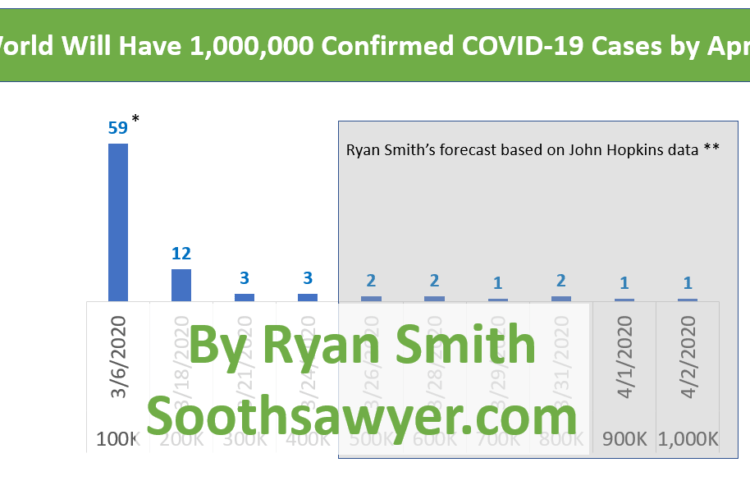
A day doesn’t go by without hearing someone talking about COVID-19. And with the 5-day moving average of the daily growth rate for confirmed cases hovering at 11% (16% excluding China), it’s hard not to see frightening numbers of new cases. On March 24, the global daily growth rate sat at 13%, excluding China (it’s […]
For those of you tracking COVID-19 (Coronavirus) thru John Hopkins, they modified their time series database schema on March 23, 2020 and deprecated their previous schema immediately. I recreated the older schema version of the following files (up to date with September 1, 2021 data). These files have ALL historical data from John Hopkins. You […]
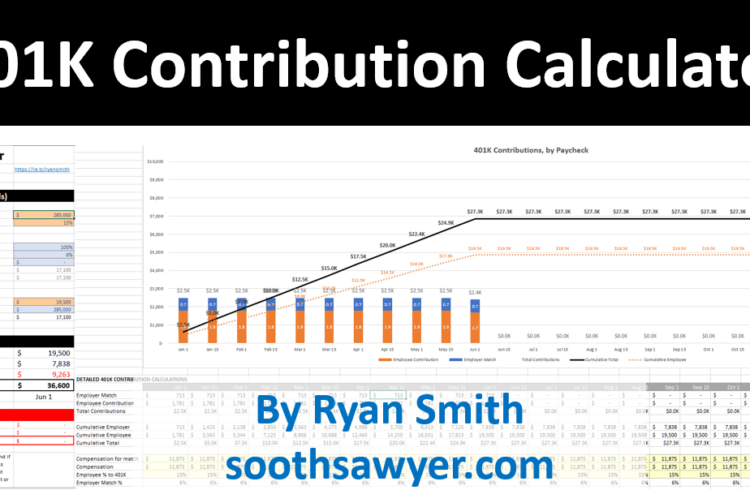
I have maxed out my 401K every mid-year since I was in my mid-20s and thought I was doing the right thing. What could be wrong with investing in the stock market sooner and getting a bump in pay when you max out mid-year? So last year, I decided to be even more aggressive and […]
Download the 401K Employee Contribution Calculator now Ever wonder what the ideal percentage you should be contributing to your 401K is? It’s more difficult than you may think and you might accidentally be losing out on employer contributions. Things you need to consider: Employer Matching level (e.g., 50%, 100%) Max Employer Matching (e.g., 4%, 5%, […]
On a recent trip to Las Vegas, I encountered a few robots. No, it was not street performers and no it wasn’t a comic convention. 🙂 You know, I can read about tech taking over jobs all day long.. but when I see two instances of it on one weekend trip, it really got me […]
When I first entered the workforce, I was always curious to know how much people made. I don’t remember why, but it probably had something to do with wondering what I wanted to be when I “grew up”. Since I’ve been diving deep into Pure Storage (PSTG) financial statements, I’m going to take the opportunity […]
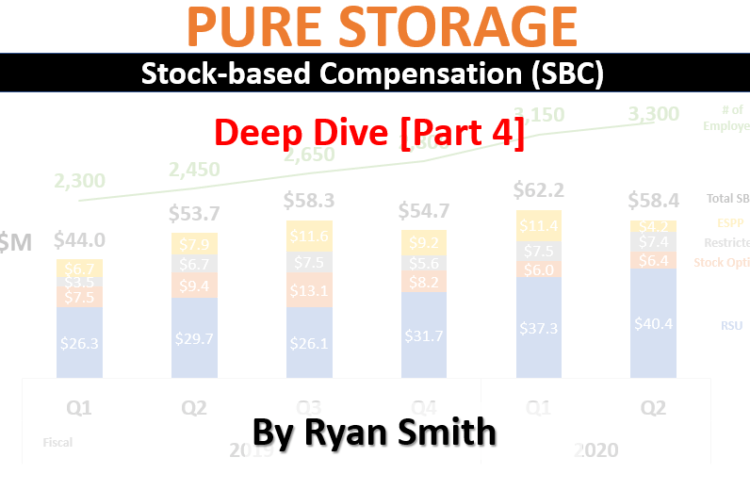
In my first part of the Pure Storage Deep Dive, I illustrated how stock-based compensation (SBC) at Pure Storage (PSTG) is large enough to not ignore when looking at the fundamentals of the company. Let’s compare Pure to its peers to see how unique Pure Storage is in its SBC plan to employees. Please read […]
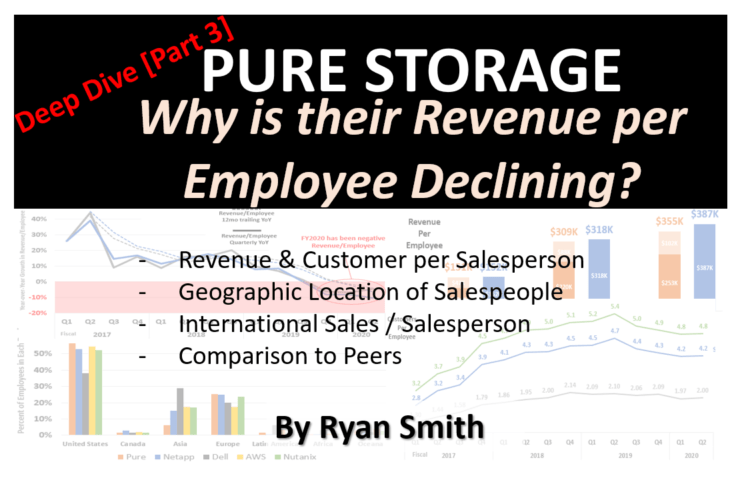
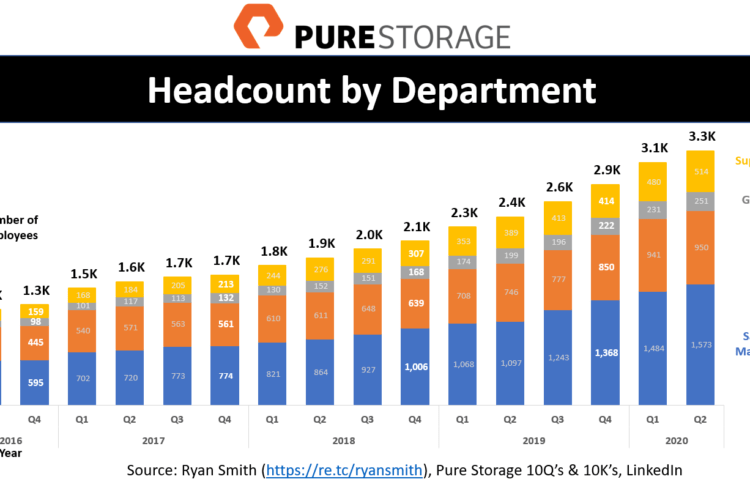
If you haven’t read Part 1 or Part 2 of this deep dive, I encourage you to read those as this post will leverage findings from there. As covered in Part 1 of this Pure Storage Deep Dive, the revenue per employee at Pure Storage has been declining. This data, along with headcount demographics also […]
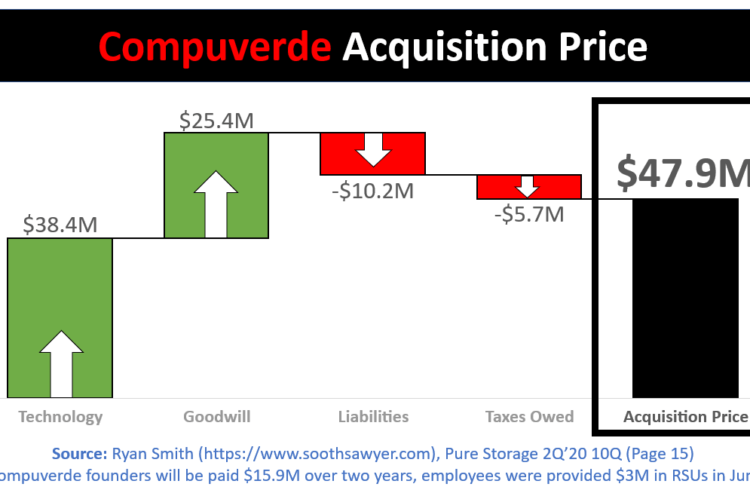
Although Compuverde was acquired in April 2019, I have not seen any coverage over the acquisition price. I happened to stumble upon it while combing over the 2Q’FY20 Pure Storage 10Q statement so thought I’d quickly share with you; I really do need to find some late-night shows to watch; any recommendations? From Pure’s 10Q, […]
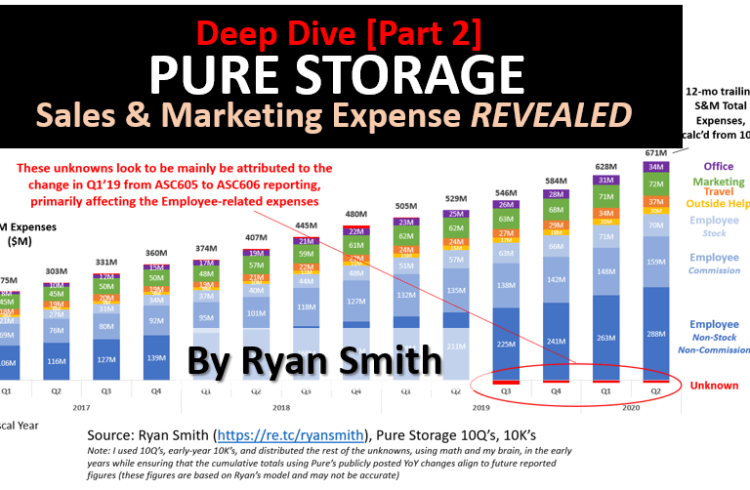
In Part 1 of our Pure Storage Deep Dive, we explored Pure Storage’s (PSTG) revenue, expenses, operating margin, and headcount demographics that details their employee base as never explored before (If you didn’t read it yet, click here). In this part (Part 2), we are going to dive deeper into what makes up Pure’s largest […]
This post is an excerpt from Part 1 of my deep dive on Pure Storage. This post will just discuss the number of Pure Storage employees. You can find way more details on Pure Storage in Part 1, Part 2, Part 3, and Part 4 of my deep dive. To gather the detailed number of […]
Pure Storage [PSTG] was founded in 2009 and came out of stealth in 2011 as an Enterprise Storage provider. Pure is known in the market for early innovation around NAND Flash in Enterprise Storage Arrays w/ Data Reduction and a unique go-to-market strategy. However, now every vendor has Flash and Data Reduction technology, and has […]
This list of linux commands, scripts, and tips was created by me (Ryan) over 10 years ago. They were useful when working with various hardware components, such as peripheral buses (e.g., FC, SCSI, SAS) and devices (e.g., SES, SATA, SAS). There are also general purpose commands mixed in there as well. Since I created this […]
Zoom in to image above Last year, I posted the Flash Supplier engagement at FMS on LinkedIn. I thought it would be interesting to quickly look at this year and see how this year’s engagement compares to last. Noteworthy changes from last year: Intel and WD are significantly upping their game on sessions. Have much […]
Update: This analysis was featured on Backblaze’s Blog and I got to meet the executive staff at Backblaze to discuss my findings; The team and culture there is amazing! It is now common practice for end-customers to share telemetry (“call home”) data with their vendors. My analysis below shares some insights about your business that […]
This post briefly explains how I took the raw SMART data (drive health data) from Backblaze and turned it into insights on my previous post. Backblaze posts all of its SMART data on the following page: https://www.backblaze.com/b2/hard-drive-test-data.html I downloaded the zip files and imported the data into MySQL. After importing the data, I used the […]
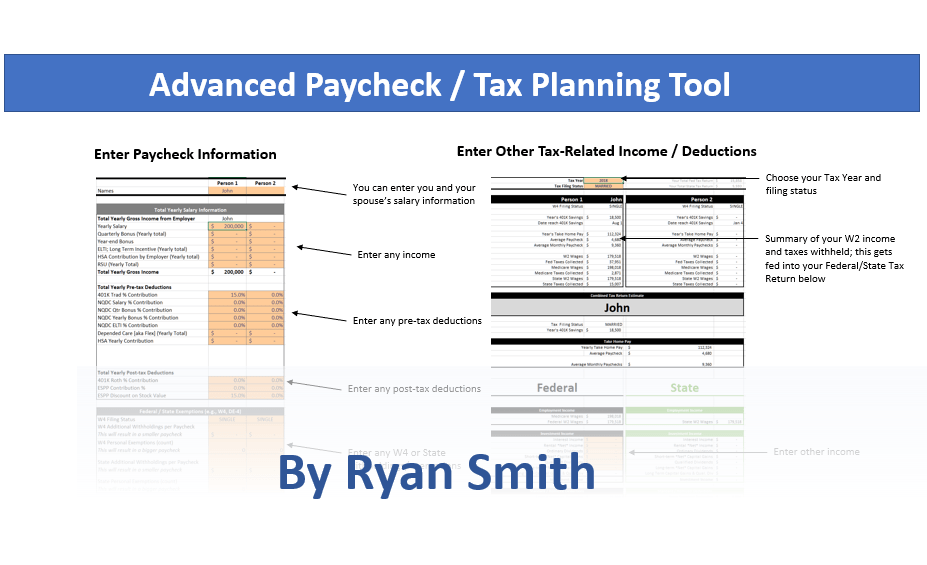
Download the Excel-based Paycheck and Tax Forecasting Tool by clicking here For those that know me, one of my passions is personal finance (along with public speaking, influencing, practical applications of technology, data analysis, helping others). As I have grown older, I have come to appreciate the importance of planning taxes and choices around income/deductions more […]
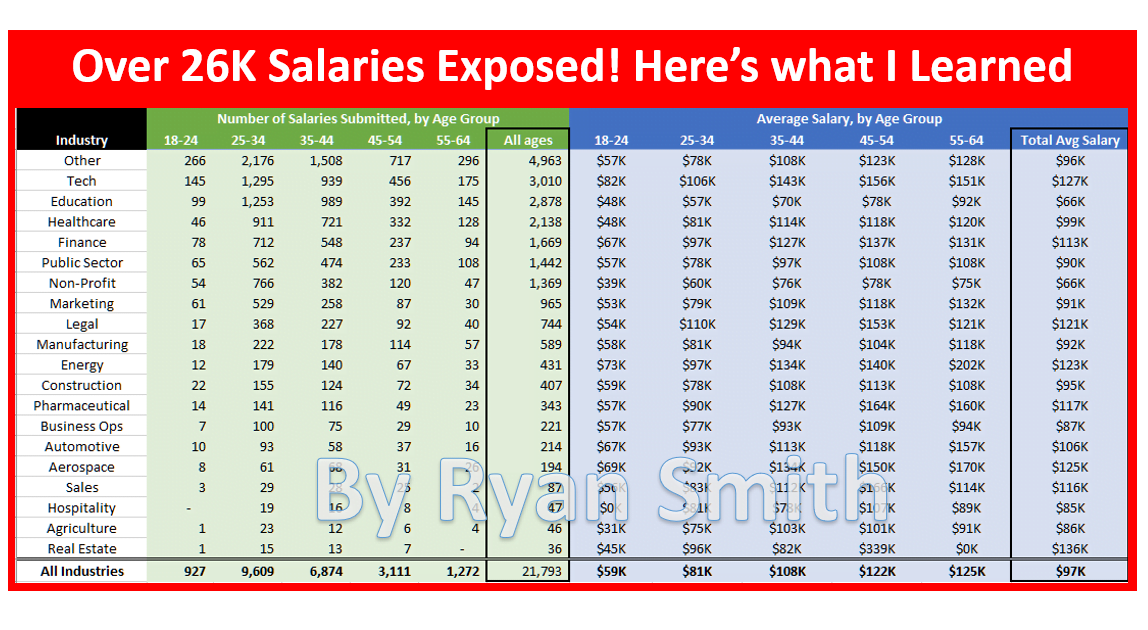
About a week ago, askamanager.org (with 2 million monthly visitors) collected over 26,000 salaries from ordinary people like you and me. And Alison Green was kind of enough to share the Google spreadsheet of all the submissions. Although there are some issues with the data collected (which I’ll talk about at the end of this post for those that care), […]
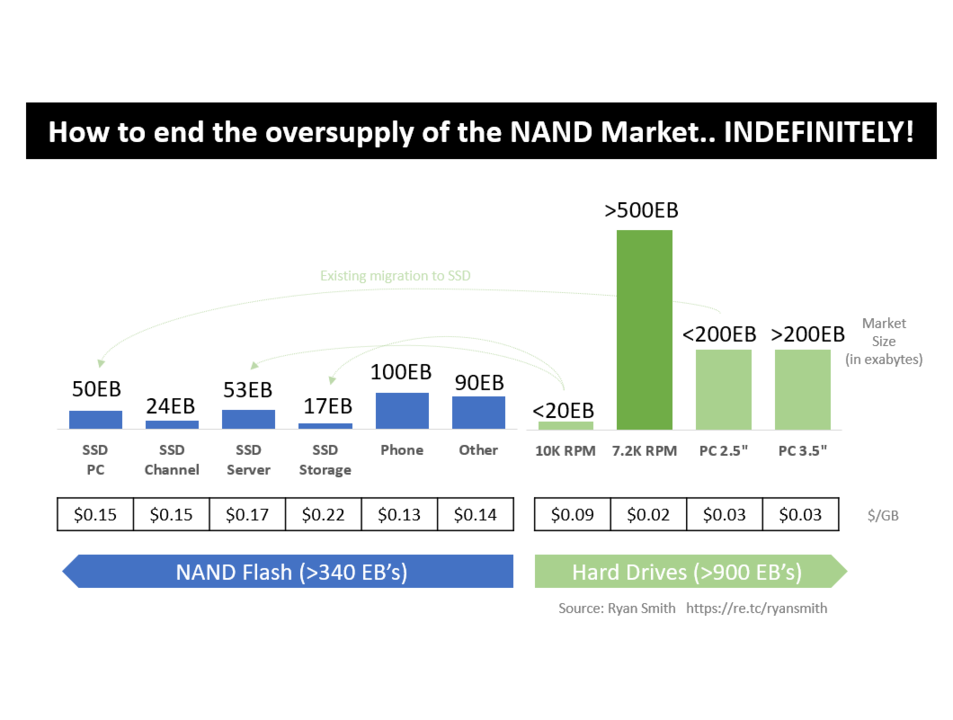
Last year, the NAND industry produced around 5 exabytes of extra supply. That is 5,000,000,000 GB’s (the equivalent to 5 million 1TB SSD’s) worth of extra parts just sitting around! When that happens, you have an oversupply situation and prices decline dramatically. NAND vendors absolutely hate this. In a balanced market, you could expect anywhere between 20-25% […]
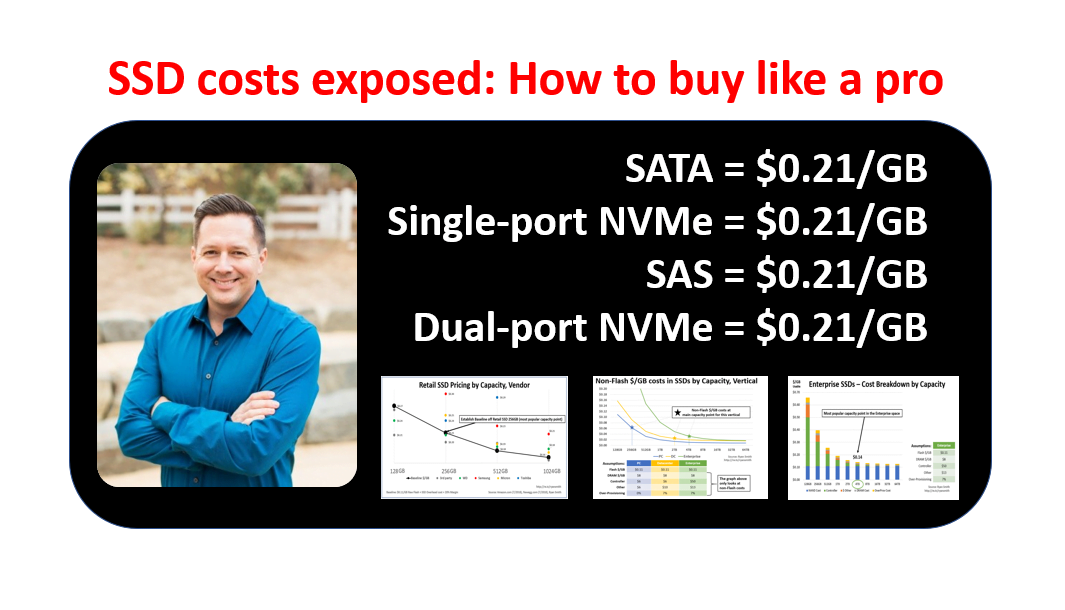
What you will learn in this article After reading this article, you will learn: All SSDs in all verticals (e.g., PC, Retail, Datacenter, Enterprise) should be priced the same ($/GB); The key to understanding this is looking at non-NAND related costs over different capacity points, while considering the current average capacity point in each vertical. […]
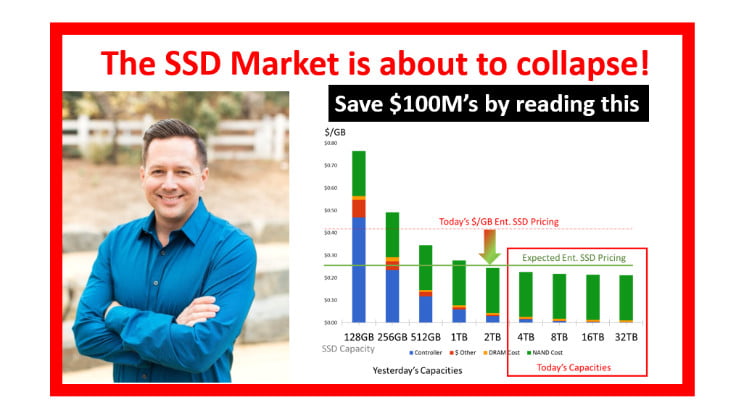
Summary: There are six major trends that are converging right now that are going to negatively impact the size of the SSD market in the near future The number of large customers of Flash (1B GB and up) have dramatically increased and will cause the OEM SSD business to “pop” and convert to low-margin NAND […]
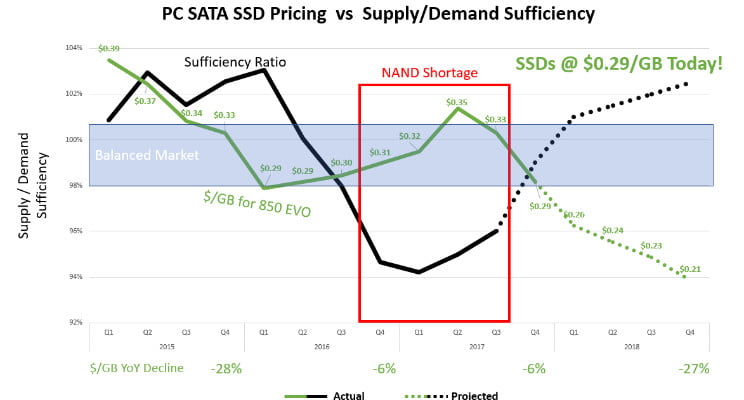
According to price trackers, the pricing of NAND Supplier-based SSDs has begun to decline; In fact, the decline began in August 2017! Let’s dig in.. Today, the pricing of PC-based 1TB SSDs is already at $0.29/GB. You can confirm this by looking at Amazon.com. ($299 divided by 1,024GB = $0.29/GB) Extrapolating the Enterprise-class pricing (section on this below), […]

