This post briefly explains how I took the raw SMART data (drive health data) from Backblaze and turned it into insights on my previous post.
Backblaze posts all of its SMART data on the following page: https://www.backblaze.com/b2/hard-drive-test-data.html
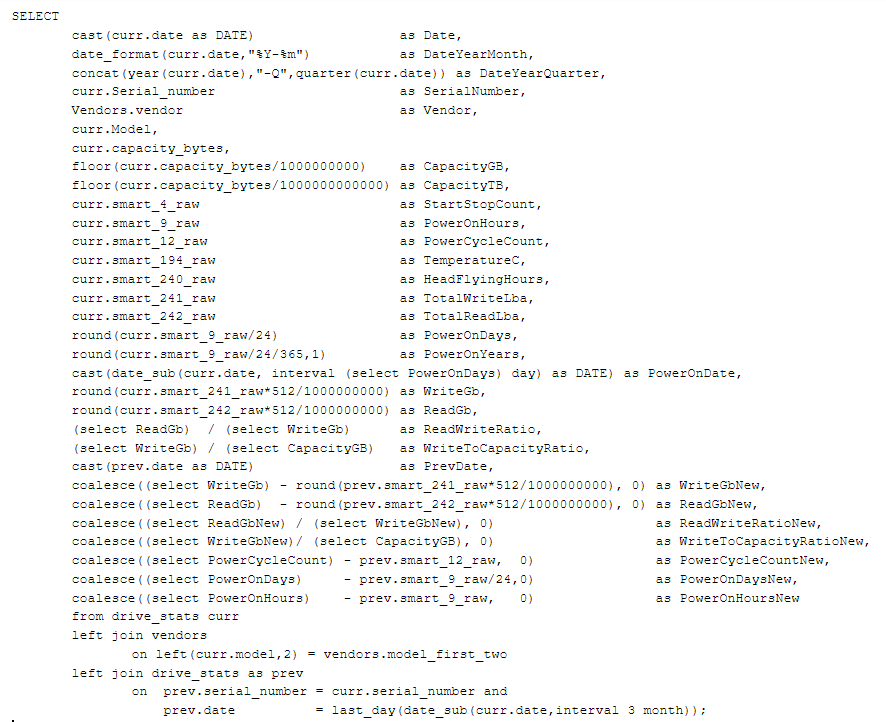
I downloaded the zip files and imported the data into MySQL. After importing the data, I used the below SELECT query to create a VIEW or TABLE that I then connected to Microsoft Excel (using Power Query) where I easily pivoted the data to come up with the insights I wrote about.
SQL Query used to transform the raw SMART data:

Additional data sources used:
- Wayback machine (to gather previous website claims of data stored)
- Backblaze blog posts and pictures (to understand rack units, number of enclosures per rack, data protection scheme to know max physical to stored data ratio)
- Google to search for average rack unit colocation costs
Any questions about this, just ask!

I have been around IT since I was in high school (running a customized BBS, and hacking) and am not the typical person that finds one area of interest at work; I have designed databases, automated IT processes, written code at the driver level and all the way up to the GUI level, ran an international software engineering team, started an e-commerce business that generated over $1M, ran a $5B product marketing team for one of the largest semiconductor players in the world, traveled as a sales engineer for the largest storage OEM in the world, researched and developed strategy for one of the top 5 enterprise storage providers, and traveled around the world helping various companies make investment decisions in startups. I also am extremely passionate about uncovering insights from any data set. I just like to have fun by making a notable difference, influencing others, and to work with smart people.
