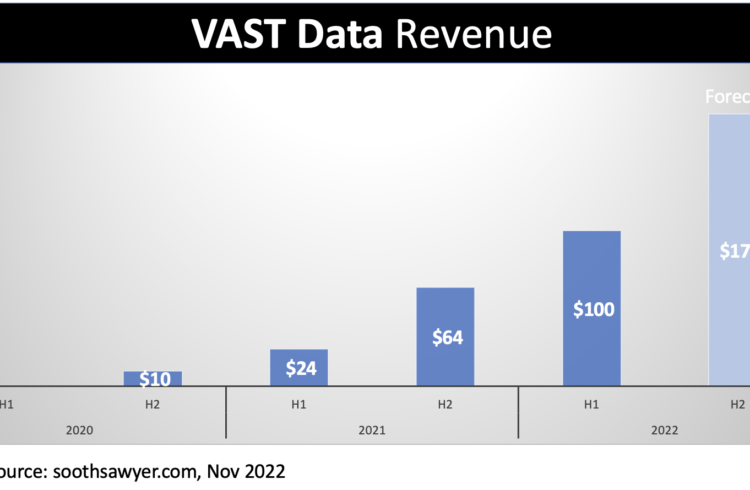
I came across enough hints from VAST Data thru their momentum posts, that I was able to determine their actual revenue to date along with an estimated NAND Flash TAM. In addition, using LinkedIn, I was able to breakdown their sales force to see what the team looks like. Why did I do this? I […]
Tag: Data Analysis
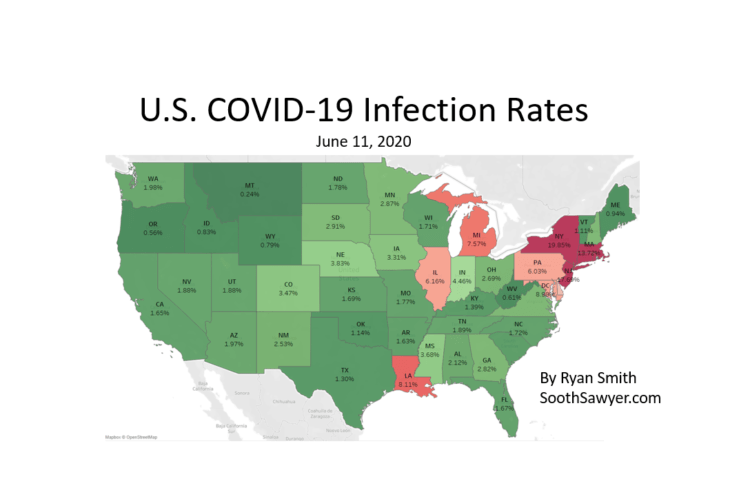
If you have been wondering what the infection rates for COVID-19 are in your state or county is, you found the one place on the internet that will cover just that. After analyzing numerous antibody studies, filtering out the non-scientifically approached ones, and correlating that with (1) other studies that looked at asymptomatic infections and […]
How do you actually use the data out there to determine your chances out there? I see the news cover confirmed cases and deaths but how does this actually translate into understanding what are your chances of bumping into someone with this invisible virus when you go grocery shopping? In order to help solve this […]
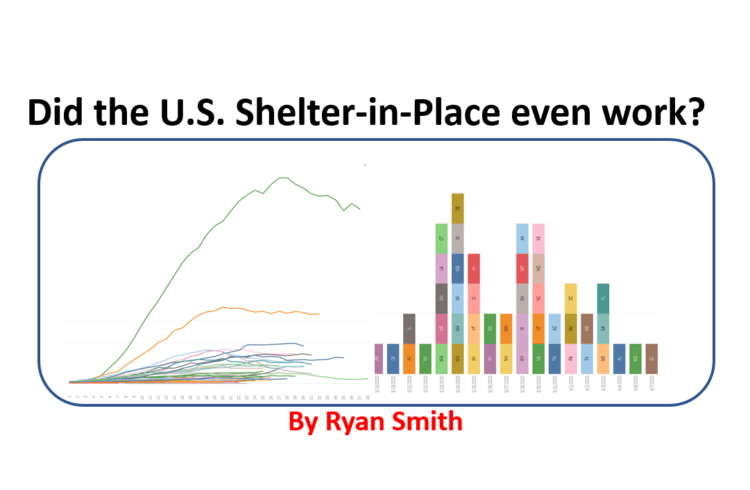
In this post, I look at all states in the U.S. by date, days since each state hit 500 cases, and days since each state’s respective shelter-in-place order. Each of these comparisons provide a unique way to accurately look for correlations. I then identify where each state’s peak is, and then compare how the U.S. […]
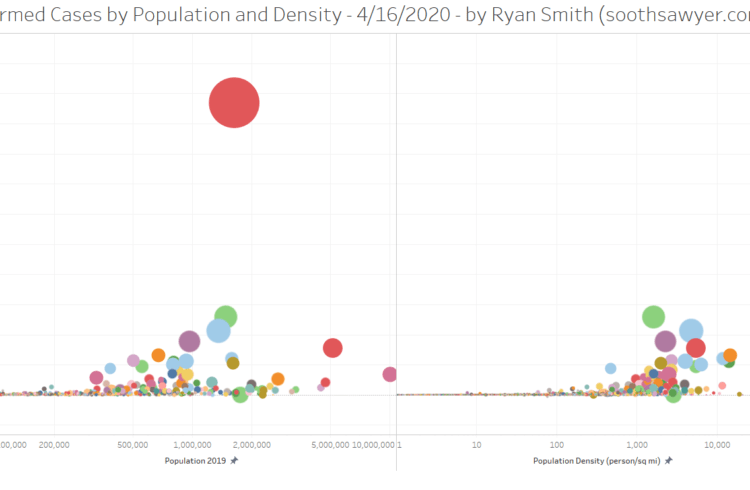
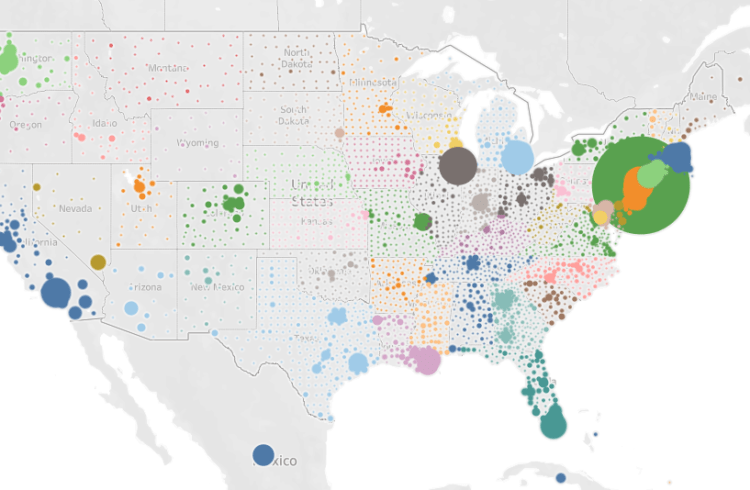
This visualization shows the growth in COVID-19 cases compared to population (4/16/2020, R=0.33) and population density (4/16/2020, R=0.75; if you look at this by Days Since instead of date, R>0.80) in the US (and the rest of North America), at the county level, from March 15th – April 16th. If you hold your mouse over […]
This visualization shows the growth in COVID-19 cases in the US (and the rest of North America), at the county level, from March 15th – April 15th. If you hold your mouse over a given county it will show you the cumulative cases/deaths, new cases/deaths, and ICU beds, in each county. You too can create […]
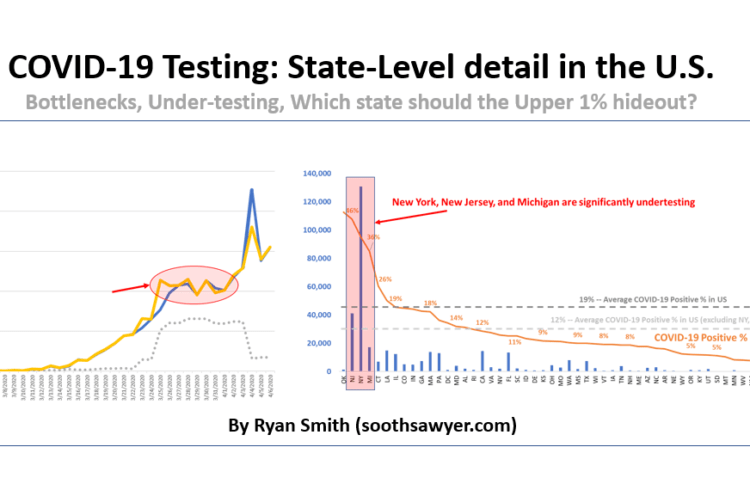
In this post, I will take a quick look at how testing is going in the United States by looking at how our testing has ramped, bottlenecked, where most of the test kits are going, where likely under-testing is happening, what the likelihood of testing positive is, and which state the upper 1% should hunker […]
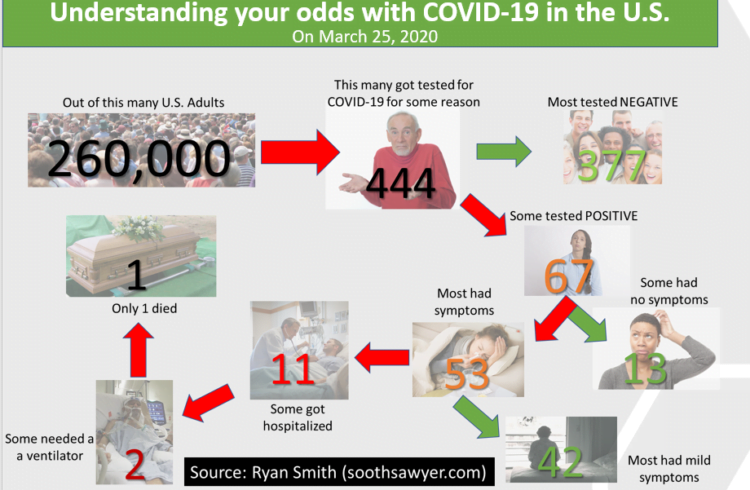
When it comes to COVID-19, it can be hard to understand how all these percentages and statistics you hear on the news are relevant to you. For this reason, I thought I’d create a simple illustration based on where things are at in the U.S. (based on my understanding of today’s figures, as outlined in […]
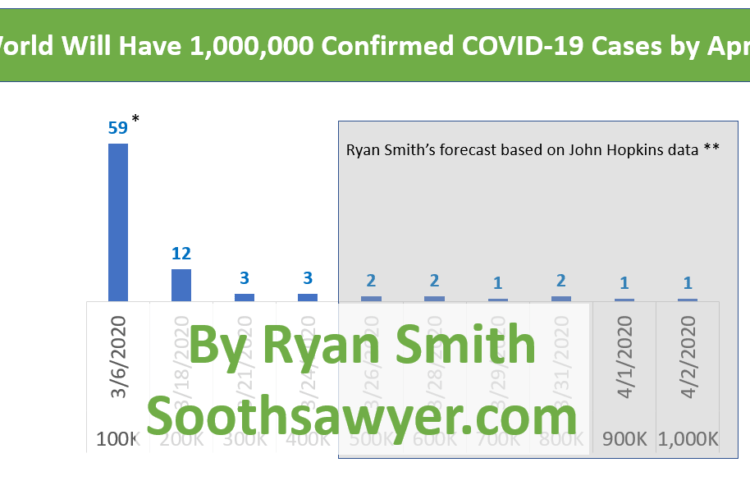
A day doesn’t go by without hearing someone talking about COVID-19. And with the 5-day moving average of the daily growth rate for confirmed cases hovering at 11% (16% excluding China), it’s hard not to see frightening numbers of new cases. On March 24, the global daily growth rate sat at 13%, excluding China (it’s […]
For those of you tracking COVID-19 (Coronavirus) thru John Hopkins, they modified their time series database schema on March 23, 2020 and deprecated their previous schema immediately. I recreated the older schema version of the following files (up to date with September 1, 2021 data). These files have ALL historical data from John Hopkins. You […]
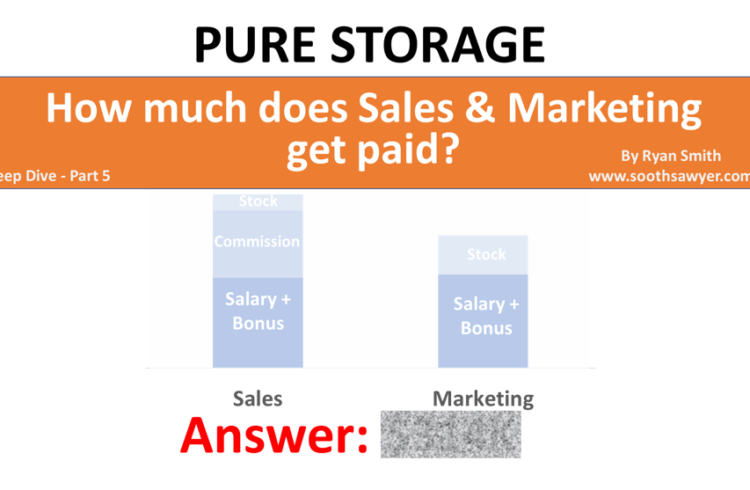
When I first entered the workforce, I was always curious to know how much people made. I don’t remember why, but it probably had something to do with wondering what I wanted to be when I “grew up”. Since I’ve been diving deep into Pure Storage (PSTG) financial statements, I’m going to take the opportunity […]
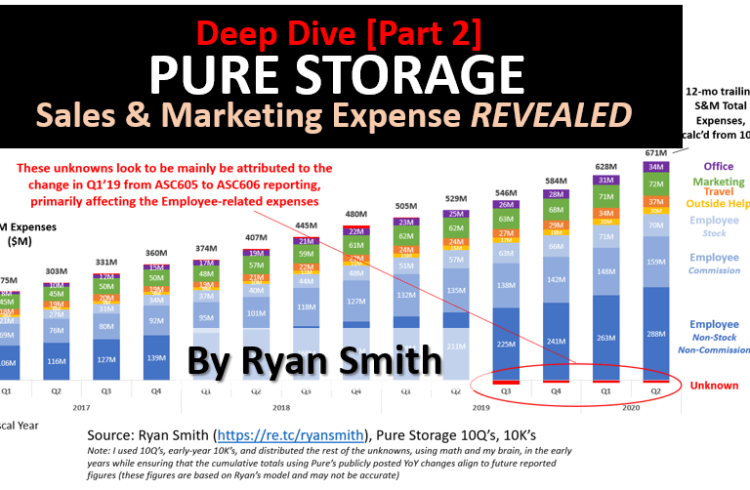
In Part 1 of our Pure Storage Deep Dive, we explored Pure Storage’s (PSTG) revenue, expenses, operating margin, and headcount demographics that details their employee base as never explored before (If you didn’t read it yet, click here). In this part (Part 2), we are going to dive deeper into what makes up Pure’s largest […]
Pure Storage [PSTG] was founded in 2009 and came out of stealth in 2011 as an Enterprise Storage provider. Pure is known in the market for early innovation around NAND Flash in Enterprise Storage Arrays w/ Data Reduction and a unique go-to-market strategy. However, now every vendor has Flash and Data Reduction technology, and has […]
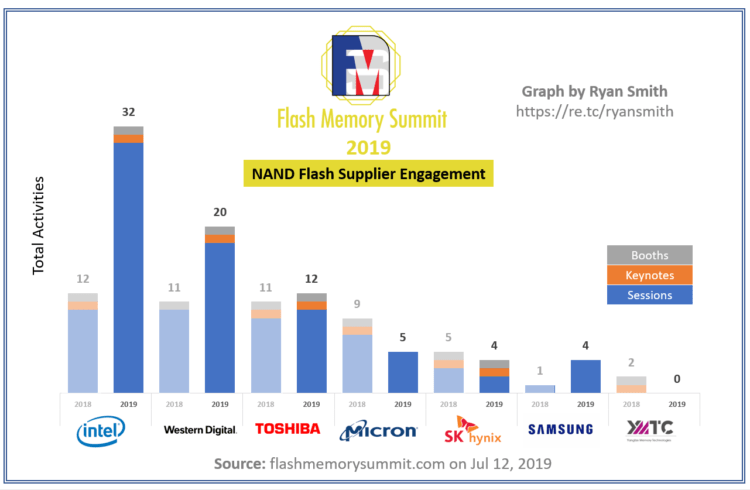
Zoom in to image above Last year, I posted the Flash Supplier engagement at FMS on LinkedIn. I thought it would be interesting to quickly look at this year and see how this year’s engagement compares to last. Noteworthy changes from last year: Intel and WD are significantly upping their game on sessions. Have much […]
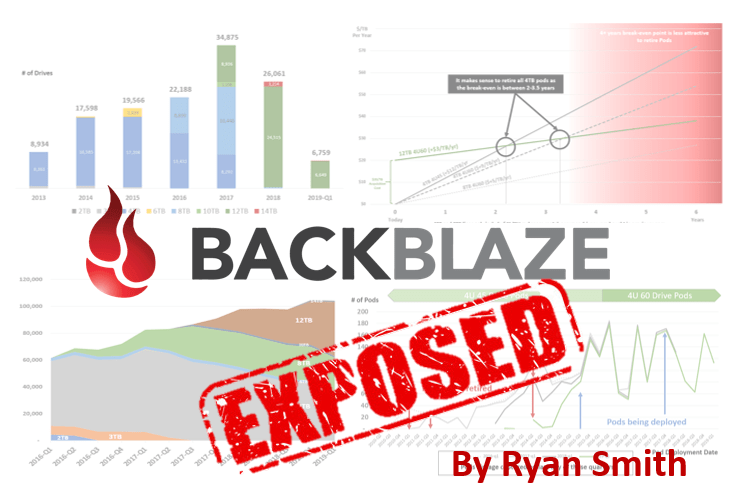
Update: This analysis was featured on Backblaze’s Blog and I got to meet the executive staff at Backblaze to discuss my findings; The team and culture there is amazing! It is now common practice for end-customers to share telemetry (“call home”) data with their vendors. My analysis below shares some insights about your business that […]
This post briefly explains how I took the raw SMART data (drive health data) from Backblaze and turned it into insights on my previous post. Backblaze posts all of its SMART data on the following page: https://www.backblaze.com/b2/hard-drive-test-data.html I downloaded the zip files and imported the data into MySQL. After importing the data, I used the […]
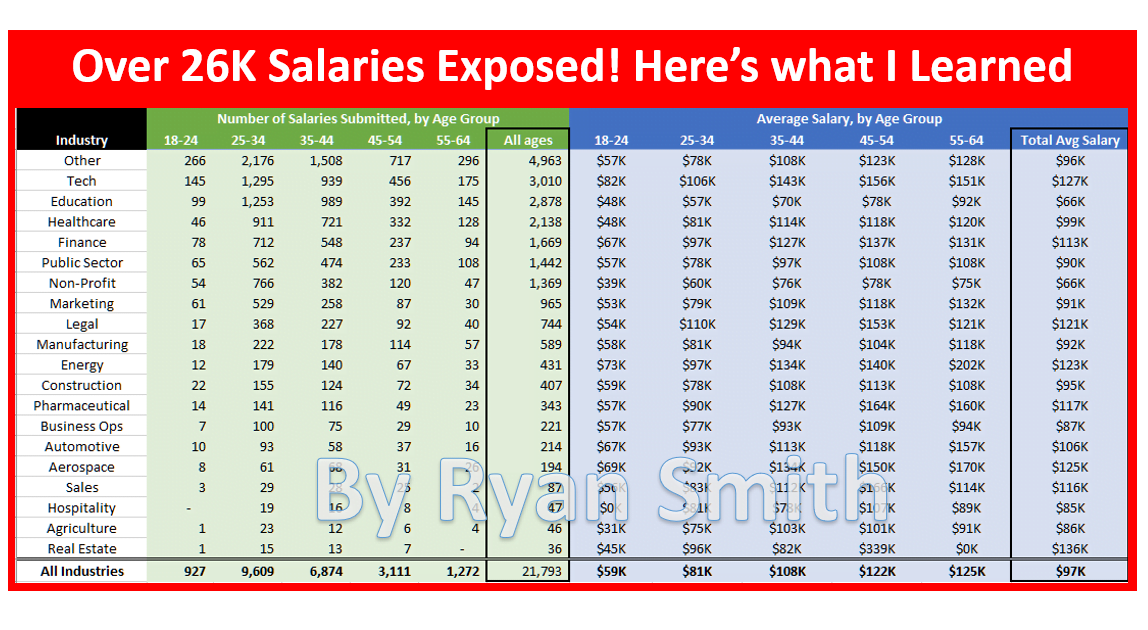
About a week ago, askamanager.org (with 2 million monthly visitors) collected over 26,000 salaries from ordinary people like you and me. And Alison Green was kind of enough to share the Google spreadsheet of all the submissions. Although there are some issues with the data collected (which I’ll talk about at the end of this post for those that care), […]
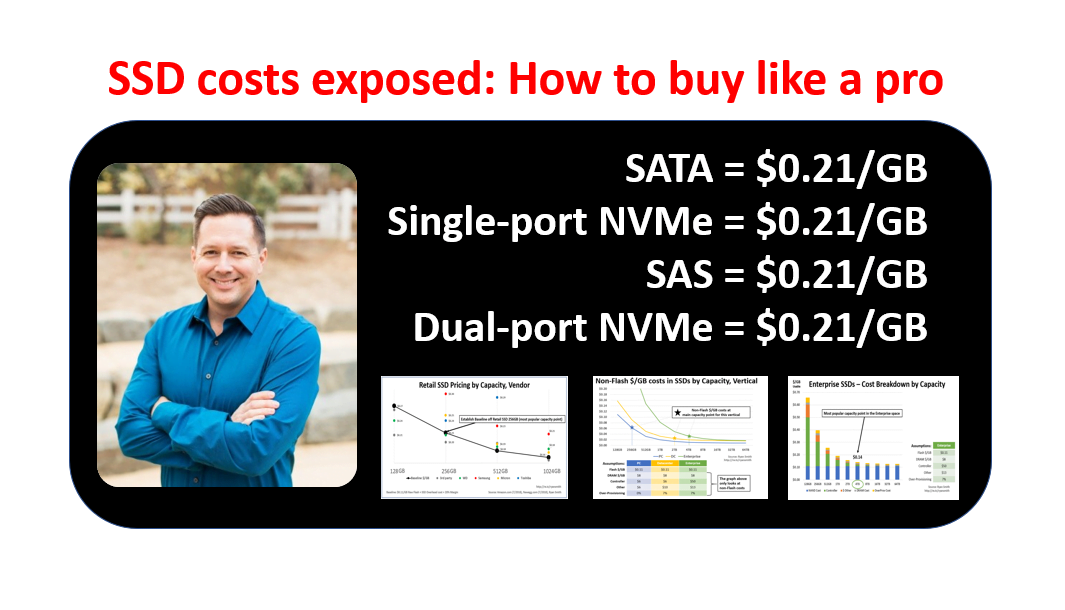
What you will learn in this article After reading this article, you will learn: All SSDs in all verticals (e.g., PC, Retail, Datacenter, Enterprise) should be priced the same ($/GB); The key to understanding this is looking at non-NAND related costs over different capacity points, while considering the current average capacity point in each vertical. […]
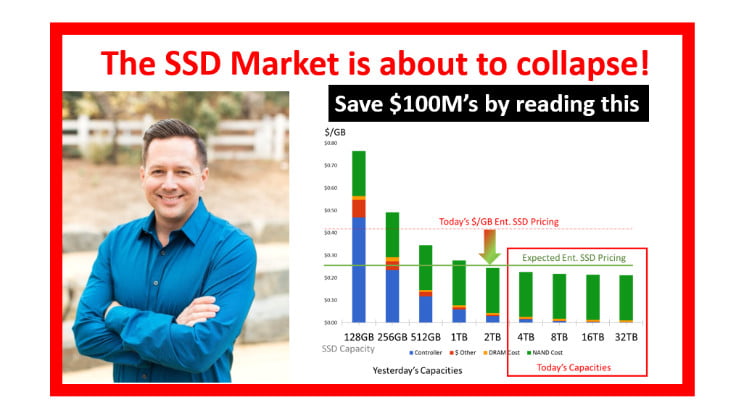
Summary: There are six major trends that are converging right now that are going to negatively impact the size of the SSD market in the near future The number of large customers of Flash (1B GB and up) have dramatically increased and will cause the OEM SSD business to “pop” and convert to low-margin NAND […]
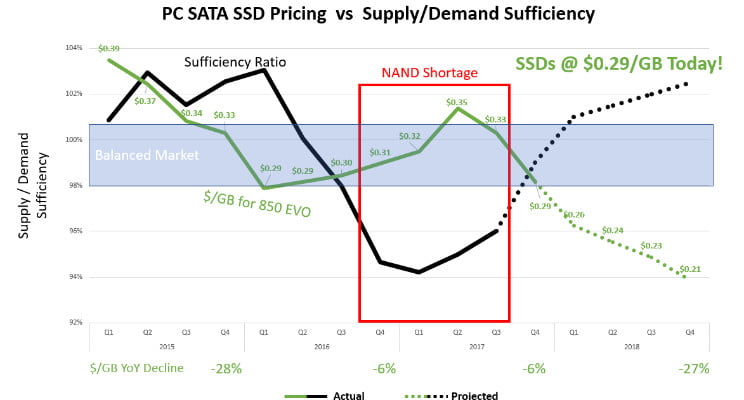
According to price trackers, the pricing of NAND Supplier-based SSDs has begun to decline; In fact, the decline began in August 2017! Let’s dig in.. Today, the pricing of PC-based 1TB SSDs is already at $0.29/GB. You can confirm this by looking at Amazon.com. ($299 divided by 1,024GB = $0.29/GB) Extrapolating the Enterprise-class pricing (section on this below), […]

